S2K Current Market Analysis
 06-07-2016, 08:10 PM
#1
Registered User

Thread Starter

The market on S2000s was something that I was very interested in as I was searching to buy my own S2000 over the past few months. I knew that I could gain some insight and purchasing guidance by collecting some easily-available data and completing statistical analysis on the available market (I am a mechanical engineer with experience analyzing complex sets of data). One of my interests was to see if I was getting a fair price. Another interest was to see what kind of loss in value I should expect through ownership. Other than that, there are still plenty of other valuable findings.
Well, I eventually purchased one ~2-3 weeks ago, but I figured that the analysis I did may be interesting to some other people who either own or want to buy an S2000. Unlike most statistics, I figured this may be fun data to share.
It’s my hope that this data is useful to the community and that we can all learn something about these cars we all love.
Data collection and background
You may choose to skip through this section if you just want to see the results.
I only collected data through Craigslist ads. The information that I could gather was only from what was available in the ad. There are many things left out from ads so I did what I could here. I collected data on the following variables:
I want to make an important note on mileage and asking price – both of these variables should have significant “binning” which changes the validity of analysis. For example, a person that has a car with 42k miles might advertise the car as “approximately 40k miles.” Or, conversely, someone with a car that has 38k miles may advertise it as “less than 40k miles.” Also I found that it was common to negate the last three digits. I can only record the value advertised. People do similar things with their asking price due to the expectation of a negotiation. This binning skews the data distribution.
Besides mileage, condition of the car would have to be the single-largest effect on the price of the car. However, I didn’t have a good way to collect and evaluate any statistical significance. I’m definitely not going to go take a personal look at 215 cars. I did take a look at 6 cars I was considering to buy, and I will draw some anecdotal conclusions on that at the end. Here are some variables not considered:
Please take note that all of my analysis is utilizing sellers asking prices, not actual selling price or value.
Distribution of the market
So here is where it starts to get fun. One of the first things I like to do with is to see if my dataset is normally distributed. Hopefully one would expect that it is normally distributed, otherwise it could be wrong to statistically analyze the data. Plus, this may mean that the data set doesn’t capture truly random independent variables.
Let’s take a look at the distribution of mileage and price. First, here is the distribution in mileage for all AP1 & AP2 cars combined.
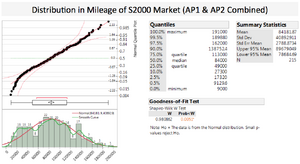
Although at first glance it does look like it fits the normal distribution curve, the goodness-of-fit test proves that this data is not normally distributed! I think this is largely an effect of the binning that I mentioned earlier and the fact that there are a large number of outliers trailing off to the left and right. Here are some findings:
Let’s see what happens if we look at AP1 & AP2 cars separately:
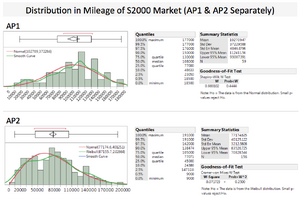
Here we go, now each of the data sets match a normal distribution or Weibull distribution if analyzed separately. As expected, the AP1 distribution is weighted more towards higher mileage (average ~103k). Average mileage for AP2 cars is ~77k. It looks like any further analysis/conclusions would be valid if we consider AP1 & AP2 cars separately.
Now let’s look at the distribution in asking price:
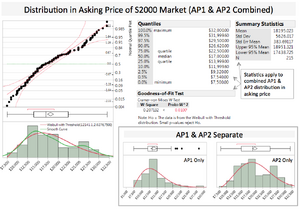
Similar situation found here. We need to consider effects on asking price by analyzing AP1 & AP2 cars separately. The average asking price for AP1 cars is $13,967. The average for AP2 cars is $19,794. Notice how the AP2 distribution looks like it is bimodal – maybe there is a stark difference in two types of owners (like weekend-only drivers vs. daily drivers)? I didn’t analyze that distribution further because my goodness-of-fit test came out positive.
Analysis on Price
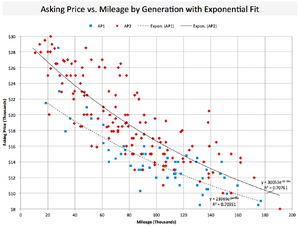
So next I wanted to plot the asking price versus mileage to get a sense of the trend.
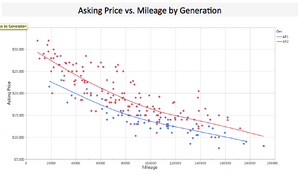
A couple of conclusions can be read from this plot. First, there is a clear offset difference in asking price between AP1 & AP2 cars. Also, look at the large spread for a given mileage, especially around ~70-80k miles. Next thing I found important: the trend as the car gets more mileage is definitely not linear, but it is not as exponential as I thought it would be. I might compare the s2k trend to different model cars later to see the difference (like an Accord or BMW). Another cool find was that the y-axis intercept at 0 miles looks the same as the original dealer sticker price of the s2k. I guess the value isn’t dropping much after 8+ years by just sitting on your car!
Next I plotted price vs. mileage weighted by the seller.
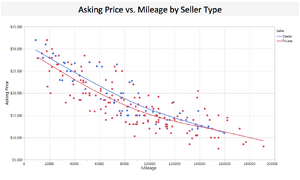
There is another clear difference between the asking price comparing private sellers to dealers (good spread found on either). One interesting thing I found is that the two intersect at ~150k miles, due to the dealer line being more linear. Maybe the dealers are using some type of mileage equation to determine price, while private parties value their cars more?
So, next I wanted to see if I lost value in the car at a different rate based on my starting mileage. For example, if I knew I would add ~40k miles to the car, would I be better off buying a lower mileage car or higher mileage car (in terms of monetary investment)?
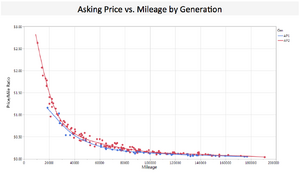
It turns out that this relationship is largely exponential, actually representing a power function. Let’s make sense of this with a couple examples.
Here’s another interesting plot of asking price by model year.
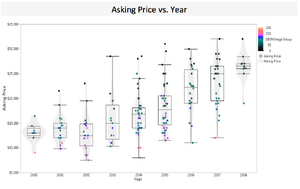
If you want the most valuable car it looks like you might be better off buying a 2008 model… but then again they are all lower mileage. This is why I included a color gradient for mileage (colors chosen for color blindness).
One interesting find is that all of the AP1 model year prices do not look significantly different from each other, but then you find this linear trend in median price that goes upwards for AP2 model years.
Statistical Analysis on Effects
I took all of the variables collected for the 215 cars and ran a statistical model. I found that the three most important variables which statistically effect price are: mileage, model year, and generation. You can find the charts below (Sorry I left the images small). The p-value for each was < .0001, suggesting they are highly significant. However… I started to think that my analysis will all be skewed by mileage…
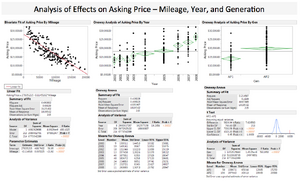
The most obvious variable was going to be mileage (my hypothesis before I started), and the other two are also significantly cross-effected by mileage. So I wanted a way to normalize the rest of the data to the mileage of the car before continuing. I went back to excel and generated plots with trendline fits that would give me a trendline equation. This would allow me to normalize the spread to the trendline.
Here are the three plots shown above with trendlines.
Note: I am displaying the trendline equation with R^2. R^2 is a method of determining how well the equation explains the data – higher R^2 means that the equation fits the data more closely (R^2 = 1.0 means that the equation can predict 100% of the expected/calculated values).
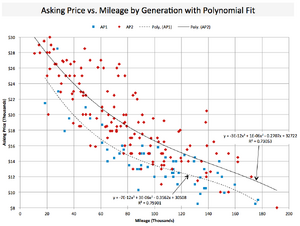
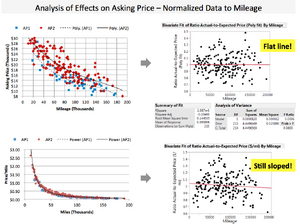
I ended up deciding to use the polynomial fit from the asking price vs mileage chart to normalize the data. Here’s why: after normalization the average value is a perfect flat line, even with all that spread in price – see the below plot.
Note: Normalized data just means that I am taking the actual value and dividing it by the calculated value by the trendline equation. So if someone is asking for $20k, but the equation says it should be $10k, then the normalized value would be 2.0. Since the trendline equation uses mileage as the independent variable, theoretically this should provide a value without dependence on mileage.
Effects on price other than mileage
So here is where more fun begins. Let’s analyze the other variables I collected data on to see what statistically significant model effects we can find.
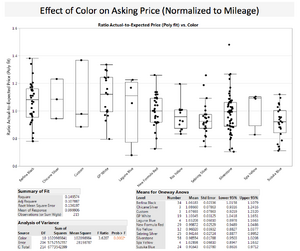
Exterior color was found to be statistically significant. How many times have you heard from someone that they have the “white tax?” Well it turns out that Grand Prix White does have the highest mean value! In order of highest asking price for standard paint colors we have: GP White, Chicane Silver, Berlina Black, and Laguna Blue. In order of lowest asking price we have: Suzuka Blue, Sebring Silver, Rio Yellow, and Silverstone. I was surprised to see that Spa Yellow (AP1) was higher ranked than Rio Yellow (AP2).
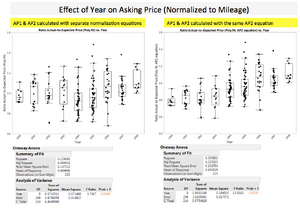
Here’s the model year proving to be significant again, even after normalizing against mileage. Maybe model year is another proxy for condition besides just in terms of miles.
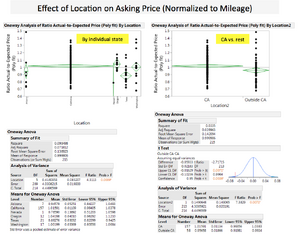
I’ve also heard people say that s2000s cost more in California than anywhere else. Well this is partly right. My data shows that California does correlate with a higher price, but surprisingly it was actually lower than Oregon, which had the highest average. Texas cars had the lowest of them all (Nevada was lower but only had 1 data point). In the future I might expand on this by seeing if there is any correlation with total available car market, total state population, or related variables.
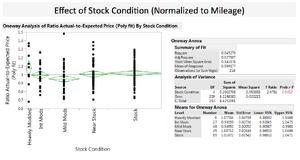
Here is the correlation between price and stock condition. Apparently heavily modded cars command the highest asking price on average. However, right behind that are stock cars. I’m not going to make many conclusions on this – recall that I don’t have high confidence in my method to assign this value to each individual car. Anyways, I think that sellers should consider selling each of their mods off before selling the car as a whole.
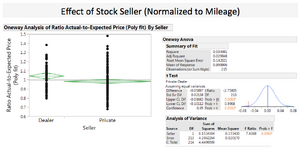
Here is statistical proof of the insight I made earlier on the data – dealers are asking for higher prices than private sellers. This may seem obvious to some of you, but I thought it was important to prove it. I was wondering if maybe it was actually private sellers that valued their cars more since this is an enthusiasts’ car, and enthusiasts want their cars to go to a good home.
Discussion
I collected all of this data in hopes of guiding me towards finding a fair price (both for the seller and me) and to select the right mileage car. I had been tossing up the idea of paying more for a lower mileage car (my budget was not very strictly limited), but ultimately decided to buy one that was in great condition with 75k miles.
Through my search, I ended up personally checking 6x s2000s before I bought one. Anecdotally, I did not feel like any of the asking prices were fair. All of the sellers that I met were willing to negotiate their price down (between 5-20%). Some sellers had a pretty close price to average and held close to their asking price, and others were asking way over the trendline for what I felt was a poor condition vehicle. Thus, this data should not be used to set a firm price for any of you buyers or sellers out there. This does not take the place of an accurate evaluation during your inspection or test drive. Instead, please just use this data as extra information and guidance on your journey.
I welcome any additional data, comments or criticism that the community can provide. We can expand on this analysis further with some further ideas (I have some of my own) or data (anyone else want to collect?).
This took me a lot of time to put together, both in manual data collection and the write-up, so I hope you all find this useful and interesting!
Well, I eventually purchased one ~2-3 weeks ago, but I figured that the analysis I did may be interesting to some other people who either own or want to buy an S2000. Unlike most statistics, I figured this may be fun data to share.
It’s my hope that this data is useful to the community and that we can all learn something about these cars we all love.
Data collection and background
You may choose to skip through this section if you just want to see the results.
I only collected data through Craigslist ads. The information that I could gather was only from what was available in the ad. There are many things left out from ads so I did what I could here. I collected data on the following variables:
- Year (I only considered AP2 cars at first, but I later looked at AP1 for the community’s sake)
- Mileage
- Ext. Color
- Asking Price
- Seller (private vs. dealer)
- Location, sub-location (only considered CA and nearby states)
- Hardtop included or no hardtop
- Stock condition (for this I had to make my own assessment of how close to stock the car was with a scale 1-5, below is the scale)
- 1. Stock – Including cars with different shift knobs or stereo headunits
- 2. Near Stock – Cars had light mods (e.g. intake, just springs, stereo amps)
- 3. Mild Mods – E.g. OEM front lips and OEM rear wing, ECU tunes, coilovers, wheels
- 4. Int Mods – Different body work (aftermarket bumpers), turbos, light engine work
- 5. Heavily Modded – it took a lot to make this list – custom paint, roll cages, etc.
- Keep in mind that I didn’t spend a ton of time making this assessment, so there is definitely error in this variable.
I want to make an important note on mileage and asking price – both of these variables should have significant “binning” which changes the validity of analysis. For example, a person that has a car with 42k miles might advertise the car as “approximately 40k miles.” Or, conversely, someone with a car that has 38k miles may advertise it as “less than 40k miles.” Also I found that it was common to negate the last three digits. I can only record the value advertised. People do similar things with their asking price due to the expectation of a negotiation. This binning skews the data distribution.
Besides mileage, condition of the car would have to be the single-largest effect on the price of the car. However, I didn’t have a good way to collect and evaluate any statistical significance. I’m definitely not going to go take a personal look at 215 cars. I did take a look at 6 cars I was considering to buy, and I will draw some anecdotal conclusions on that at the end. Here are some variables not considered:
- Condition! (again) however, I did leave out any obvious outliers like cars that weren’t running or salvage title cars
- Int. Color
- Other marketplaces e.g. s2ki.com, autotrader, etc.
- Regions outside the west & southwest U.S.
- Time of year (people claim that prices go down in the winter, which makes sense for a convertible)
Please take note that all of my analysis is utilizing sellers asking prices, not actual selling price or value.
Distribution of the market
So here is where it starts to get fun. One of the first things I like to do with is to see if my dataset is normally distributed. Hopefully one would expect that it is normally distributed, otherwise it could be wrong to statistically analyze the data. Plus, this may mean that the data set doesn’t capture truly random independent variables.
Let’s take a look at the distribution of mileage and price. First, here is the distribution in mileage for all AP1 & AP2 cars combined.

Although at first glance it does look like it fits the normal distribution curve, the goodness-of-fit test proves that this data is not normally distributed! I think this is largely an effect of the binning that I mentioned earlier and the fact that there are a large number of outliers trailing off to the left and right. Here are some findings:
- Average mileage is ~84k miles. The average s2k owner drives between 5-10k miles per year, much lower than national average.
- Standard deviation is quite large, mean +/- 1 sigma is 84k +/- 41k miles (large spread!)
- 10% of the population on the low end accounts for a spread of 18k miles, while on the high end, 10% of the distribution accounts for a spread of 52k miles.
- There appears to be a bimodal distribution, with a relatively large number of cars for sale with mileage between 20k and 50k miles.
- There are a couple strange dips. People seem to hold onto their cars from 120-130k, but want to sell between 130-140k miles. A similar low dip is found between 50-60k miles.
Let’s see what happens if we look at AP1 & AP2 cars separately:

Here we go, now each of the data sets match a normal distribution or Weibull distribution if analyzed separately. As expected, the AP1 distribution is weighted more towards higher mileage (average ~103k). Average mileage for AP2 cars is ~77k. It looks like any further analysis/conclusions would be valid if we consider AP1 & AP2 cars separately.
Now let’s look at the distribution in asking price:

Similar situation found here. We need to consider effects on asking price by analyzing AP1 & AP2 cars separately. The average asking price for AP1 cars is $13,967. The average for AP2 cars is $19,794. Notice how the AP2 distribution looks like it is bimodal – maybe there is a stark difference in two types of owners (like weekend-only drivers vs. daily drivers)? I didn’t analyze that distribution further because my goodness-of-fit test came out positive.
Analysis on Price
So next I wanted to plot the asking price versus mileage to get a sense of the trend.

A couple of conclusions can be read from this plot. First, there is a clear offset difference in asking price between AP1 & AP2 cars. Also, look at the large spread for a given mileage, especially around ~70-80k miles. Next thing I found important: the trend as the car gets more mileage is definitely not linear, but it is not as exponential as I thought it would be. I might compare the s2k trend to different model cars later to see the difference (like an Accord or BMW). Another cool find was that the y-axis intercept at 0 miles looks the same as the original dealer sticker price of the s2k. I guess the value isn’t dropping much after 8+ years by just sitting on your car!
Next I plotted price vs. mileage weighted by the seller.

There is another clear difference between the asking price comparing private sellers to dealers (good spread found on either). One interesting thing I found is that the two intersect at ~150k miles, due to the dealer line being more linear. Maybe the dealers are using some type of mileage equation to determine price, while private parties value their cars more?
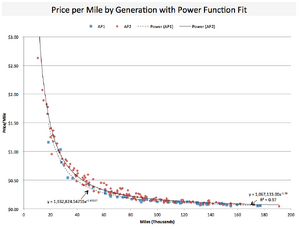
So, next I wanted to see if I lost value in the car at a different rate based on my starting mileage. For example, if I knew I would add ~40k miles to the car, would I be better off buying a lower mileage car or higher mileage car (in terms of monetary investment)?

It turns out that this relationship is largely exponential, actually representing a power function. Let’s make sense of this with a couple examples.
- Owner A buys his car at ~10k miles for ~$2.60/mile ($26k). He drives it 30k miles and sells it at ~$0.50/mile for an estimated $20k (40k miles). He lost $6k just through owning the car and driving it.
- Owner B buys his car at ~40k miles for ~$0.50/mile ($20k). He drives it the same 30k miles and sells it at ~$0.25/mile for an estimated $17.5k (70k miles). He lost $2.5k.
- However, are there any other intangible benefits? Or, will he be doing more costly maintenance between 30k & 70k miles? Up to the owner to decide.
Here’s another interesting plot of asking price by model year.

If you want the most valuable car it looks like you might be better off buying a 2008 model… but then again they are all lower mileage. This is why I included a color gradient for mileage (colors chosen for color blindness).
One interesting find is that all of the AP1 model year prices do not look significantly different from each other, but then you find this linear trend in median price that goes upwards for AP2 model years.
Statistical Analysis on Effects
I took all of the variables collected for the 215 cars and ran a statistical model. I found that the three most important variables which statistically effect price are: mileage, model year, and generation. You can find the charts below (Sorry I left the images small). The p-value for each was < .0001, suggesting they are highly significant. However… I started to think that my analysis will all be skewed by mileage…

The most obvious variable was going to be mileage (my hypothesis before I started), and the other two are also significantly cross-effected by mileage. So I wanted a way to normalize the rest of the data to the mileage of the car before continuing. I went back to excel and generated plots with trendline fits that would give me a trendline equation. This would allow me to normalize the spread to the trendline.
Here are the three plots shown above with trendlines.
Note: I am displaying the trendline equation with R^2. R^2 is a method of determining how well the equation explains the data – higher R^2 means that the equation fits the data more closely (R^2 = 1.0 means that the equation can predict 100% of the expected/calculated values).


I ended up deciding to use the polynomial fit from the asking price vs mileage chart to normalize the data. Here’s why: after normalization the average value is a perfect flat line, even with all that spread in price – see the below plot.
Note: Normalized data just means that I am taking the actual value and dividing it by the calculated value by the trendline equation. So if someone is asking for $20k, but the equation says it should be $10k, then the normalized value would be 2.0. Since the trendline equation uses mileage as the independent variable, theoretically this should provide a value without dependence on mileage.

Effects on price other than mileage
So here is where more fun begins. Let’s analyze the other variables I collected data on to see what statistically significant model effects we can find.

Exterior color was found to be statistically significant. How many times have you heard from someone that they have the “white tax?” Well it turns out that Grand Prix White does have the highest mean value! In order of highest asking price for standard paint colors we have: GP White, Chicane Silver, Berlina Black, and Laguna Blue. In order of lowest asking price we have: Suzuka Blue, Sebring Silver, Rio Yellow, and Silverstone. I was surprised to see that Spa Yellow (AP1) was higher ranked than Rio Yellow (AP2).

Here’s the model year proving to be significant again, even after normalizing against mileage. Maybe model year is another proxy for condition besides just in terms of miles.

I’ve also heard people say that s2000s cost more in California than anywhere else. Well this is partly right. My data shows that California does correlate with a higher price, but surprisingly it was actually lower than Oregon, which had the highest average. Texas cars had the lowest of them all (Nevada was lower but only had 1 data point). In the future I might expand on this by seeing if there is any correlation with total available car market, total state population, or related variables.

Here is the correlation between price and stock condition. Apparently heavily modded cars command the highest asking price on average. However, right behind that are stock cars. I’m not going to make many conclusions on this – recall that I don’t have high confidence in my method to assign this value to each individual car. Anyways, I think that sellers should consider selling each of their mods off before selling the car as a whole.

Here is statistical proof of the insight I made earlier on the data – dealers are asking for higher prices than private sellers. This may seem obvious to some of you, but I thought it was important to prove it. I was wondering if maybe it was actually private sellers that valued their cars more since this is an enthusiasts’ car, and enthusiasts want their cars to go to a good home.
Discussion
I collected all of this data in hopes of guiding me towards finding a fair price (both for the seller and me) and to select the right mileage car. I had been tossing up the idea of paying more for a lower mileage car (my budget was not very strictly limited), but ultimately decided to buy one that was in great condition with 75k miles.
Through my search, I ended up personally checking 6x s2000s before I bought one. Anecdotally, I did not feel like any of the asking prices were fair. All of the sellers that I met were willing to negotiate their price down (between 5-20%). Some sellers had a pretty close price to average and held close to their asking price, and others were asking way over the trendline for what I felt was a poor condition vehicle. Thus, this data should not be used to set a firm price for any of you buyers or sellers out there. This does not take the place of an accurate evaluation during your inspection or test drive. Instead, please just use this data as extra information and guidance on your journey.
I welcome any additional data, comments or criticism that the community can provide. We can expand on this analysis further with some further ideas (I have some of my own) or data (anyone else want to collect?).
This took me a lot of time to put together, both in manual data collection and the write-up, so I hope you all find this useful and interesting!

The following 11 users liked this post by adept:
06LagunaBlue (01-11-2018),
Aurex (03-21-2018),
Bullwings (03-22-2018),
DongTran (04-08-2018),
elvis14 (03-10-2017),
and 6 others liked this post.
 06-08-2016, 03:08 AM
#4
Community Organizer


Death by powerpoint comes to mind..... 
Nice work collecting all that data.
OP, what's your occupation?
Nice work collecting all that data.
OP, what's your occupation?
Trending Topics
06-08-2016, 05:31 AM
#8
Moderator


You!

Awesome data collection sir! I stats
stats
Awesome data collection sir! I
stats
 06-08-2016, 06:19 AM
#10
Community Organizer
...and we have a Redditor.