
Net power output

Thread Starter


Joined: Sep 2004
Posts: 6,223
Likes: 4
From: Orange County, CA
After lots and lots of discussion over the last year between myself an a AP1 owner, I decided to do some math to determine, do AP2s actually put out more power?
This is what was done:
Dyno logs (from a dynapack) were imported from the following cars:
AP2 (06) with a hondata flash (but otherwise stock) 230hp@8000RPM peak output, 8100 fuel cut
AP1 (03) with a J's racing 70RR and no tune. 216hp@8300 peak output, 8900 fuel cut.
Obviously the F22C has a higher peak output, but my argument was that while the F22C has a higher peak output, the AP1 has a wider powerband. His theory was that the power deficiency is such that the wider powerband isn't enough to compensate for the lower horsepower output.
The following graph was made factoring in gear multiplication. Additionally, the math happens to work out that a 4.57 Final Drive makes the AP1 gearing pretty close to stock AP2 gearing. The following assumptions are used: 255/40/17 rear tires (so that tires are not a variable); drivetrain loss isn't a factor in net output (because both cars are dynoed on the same dynapack), and that weight isn't a factor since we're speaking strictly output.
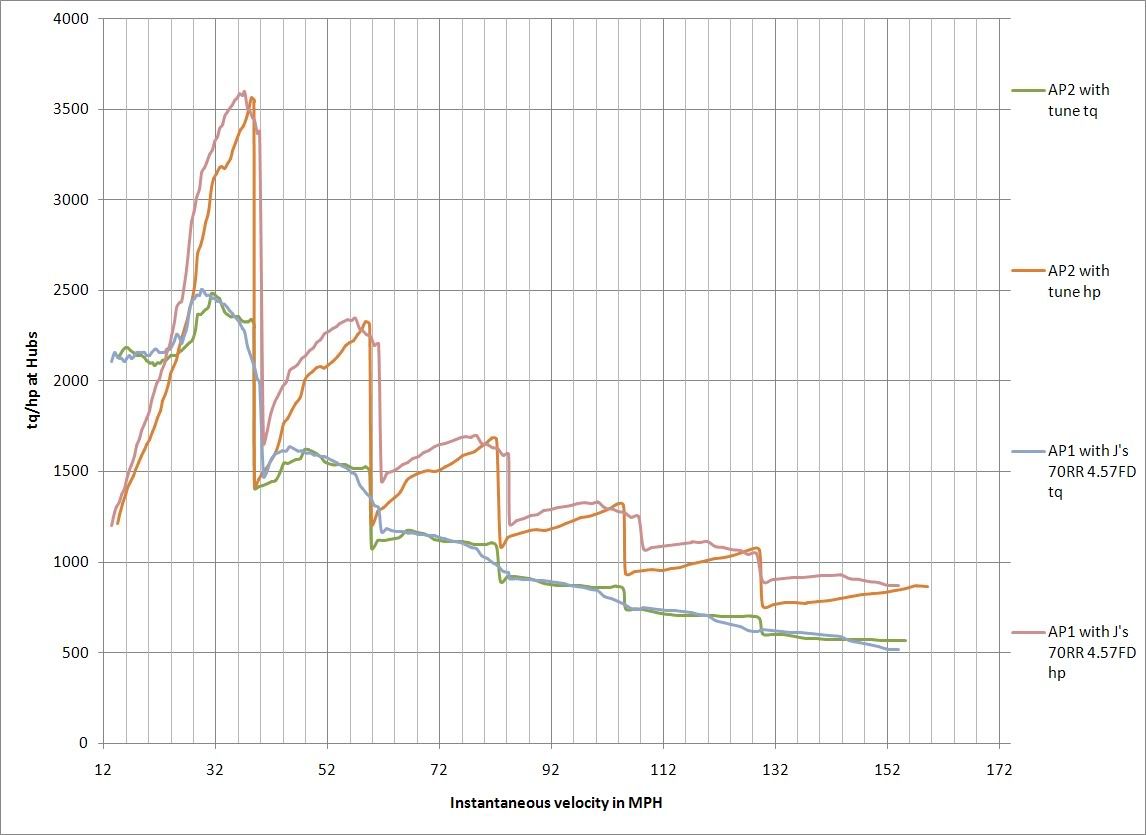
Clearly, a higher redline would really benefit the AP2.
AP2 + 70RR + tune (252hp @ 8000RPM)
vs
AP1 + 70RR + 4.57 FD
Feedback and potential corrections are appreciated.
This is what was done:
Dyno logs (from a dynapack) were imported from the following cars:
AP2 (06) with a hondata flash (but otherwise stock) 230hp@8000RPM peak output, 8100 fuel cut
AP1 (03) with a J's racing 70RR and no tune. 216hp@8300 peak output, 8900 fuel cut.
Obviously the F22C has a higher peak output, but my argument was that while the F22C has a higher peak output, the AP1 has a wider powerband. His theory was that the power deficiency is such that the wider powerband isn't enough to compensate for the lower horsepower output.
The following graph was made factoring in gear multiplication. Additionally, the math happens to work out that a 4.57 Final Drive makes the AP1 gearing pretty close to stock AP2 gearing. The following assumptions are used: 255/40/17 rear tires (so that tires are not a variable); drivetrain loss isn't a factor in net output (because both cars are dynoed on the same dynapack), and that weight isn't a factor since we're speaking strictly output.
Clearly, a higher redline would really benefit the AP2.
AP2 + 70RR + tune (252hp @ 8000RPM)
vs
AP1 + 70RR + 4.57 FD
Feedback and potential corrections are appreciated.


Registered User

Joined: May 2007
Posts: 2,617
Likes: 7
From: socal
The graphs are plotted based on raw data calculated using the gear ratios from the AP1 and AP2 gearboxes. Are you asking about transmission losses?
Thread Starter
Joined: Sep 2004
Posts: 6,223
Likes: 4
From: Orange County, CA
You'll notice that the torque (force) to the wheels is actually pretty similar at any given velocity when the AP1 has a 4.57 FD. However, when you factor in RPM, the AP1 puts out more power (work over time) than a AP2.
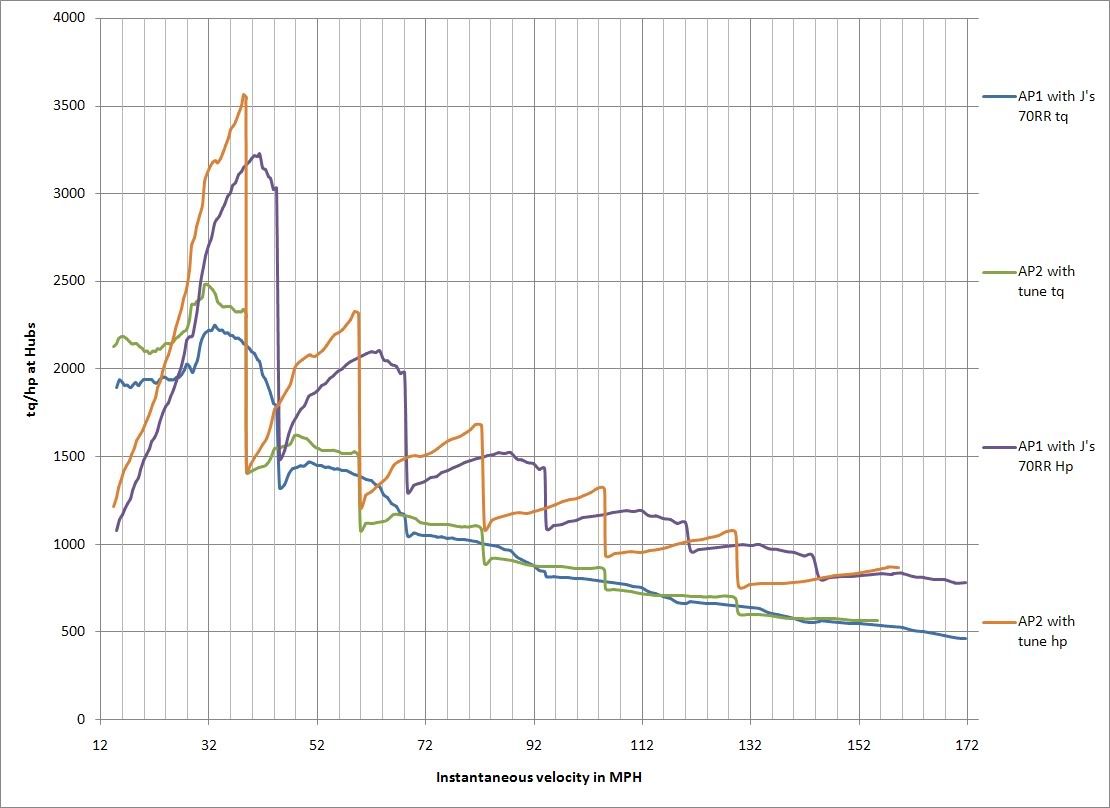
To illustrate, here's the same comparison as the 1st graph, except without the 4.57FD on the AP1.
Joined: Apr 2009
Posts: 2,521
Likes: 1
From: Renton, WA
Well I meant that you put a 4.57 FD on the AP1 in order to eliminate the transmission as a variable, ie cancel it out by making both the AP1 and AP2 with the same gearing. Unless I misunderstood something.

Joined: Jun 2006
Posts: 672
Likes: 3
Using stock dynos would make for a cleaner argument.
The ability to achieve similar speed in gear with ~10% (4.56 vs 4.10) shorter final drive more than makes up for the increased trq output of the 2.2 (153 ft-lbs vs 162 ft-lbs or a 6% increase).
That's not to say one is superior to the other, many other factors to consider, but the 2.0L does have the AUC edge.
Trending Topics
Joined: Jan 2010
Posts: 23,911
Likes: 4
From: Benicia, CA
Curious, if you have a flashpro... why in the world are you basing the F22 off 8/8.1k? You can raise it to 8.5/8.6 without worry... so you're talking about a difference of ~400rpms in which the answer is obvious.
I've also never seen a F20 that makes 225/165 (SAE corrected to the wheels) with boltons like my f22 makes.
I've also never seen a F20 that makes 225/165 (SAE corrected to the wheels) with boltons like my f22 makes.

Joined: Feb 2007
Posts: 6,863
Likes: 125
From: Pawtucket, RI
Charts are screwed up on hp. Hp at the hubs is equal to horsepower at the flywheel minus driveline losses. While you make much much greater rear wheel torque than engine torque due to gearing, you can NEVER make more rear wheel horsepower than flywheel horsepower. Horsepower levels should be about the same in each gear, and should be in the expected rear-wheel horsepower range.