
Net power output

Thread Starter


Joined: Sep 2004
Posts: 6,223
Likes: 4
From: Orange County, CA
$!*I@#&^%*@#^*(!~@&%# I typed up a long reply and it disappeared.
We're more interested in "area under the curve" rather than the raw numbers. The numbers themselves have little meaning; rather, its the delta that concerns us.
Additionally, 8.5+ redlines have proven (in my case) to significantly increase engine wear. I have a soft cut at 8300 and hard cut at 8400, which has shown not to significantly increase wear. My data agrees with Shawn Church's recommendation that 8400 be the limiter, as anything higher will start decreasing the engine's life.
That tune is not the dyno used for this comparison, as it just introduces another outside influence, which I am trying to avoid.
The graphs are made using 8.1k and 8.9k redlines.
Please give me the appropriate references and/or formulas so that I can correct. I'm neither an engineer nor an expert, and am using this as an exercise to further my understanding.
I understand that power is work over time. However, if the graphs are wrong, the relative delta in power output between the two will remain the same if compared as a percentage. If there is more force (tq) over a given period of time, isn't there more work (horsepower) being done? Should HP be (properly) plotted using ONLY the raw hp number without factoring gearing into the calculation?
Assuming the F20C and F22C are geared identically to have the same maximum velocity in each gear, the F20C would have nearly 10% more torque multiplication due to higher RPM. This is reflected in power output (which does account for RPM), but not the torque graph (which only factors in gearing but not RPM).
I'm very open to corrections
Curious, if you have a flashpro... why in the world are you basing the F22 off 8/8.1k? You can raise it to 8.5/8.6 without worry... so you're talking about a difference of ~400rpms in which the answer is obvious.
I've also never seen a F20 that makes 225/165 (SAE corrected to the wheels) with boltons like my f22 makes.
I've also never seen a F20 that makes 225/165 (SAE corrected to the wheels) with boltons like my f22 makes.
Additionally, 8.5+ redlines have proven (in my case) to significantly increase engine wear. I have a soft cut at 8300 and hard cut at 8400, which has shown not to significantly increase wear. My data agrees with Shawn Church's recommendation that 8400 be the limiter, as anything higher will start decreasing the engine's life.
That tune is not the dyno used for this comparison, as it just introduces another outside influence, which I am trying to avoid.
The graphs are made using 8.1k and 8.9k redlines.
Charts are screwed up on hp. Hp at the hubs is equal to horsepower at the flywheel minus driveline losses. While you make much much greater rear wheel torque than engine torque due to gearing, you can NEVER make more rear wheel horsepower than flywheel horsepower. Horsepower levels should be about the same in each gear, and should be in the expected rear-wheel horsepower range.
I understand that power is work over time. However, if the graphs are wrong, the relative delta in power output between the two will remain the same if compared as a percentage. If there is more force (tq) over a given period of time, isn't there more work (horsepower) being done? Should HP be (properly) plotted using ONLY the raw hp number without factoring gearing into the calculation?
Assuming the F20C and F22C are geared identically to have the same maximum velocity in each gear, the F20C would have nearly 10% more torque multiplication due to higher RPM. This is reflected in power output (which does account for RPM), but not the torque graph (which only factors in gearing but not RPM).
I'm very open to corrections
Joined: Apr 2009
Posts: 2,521
Likes: 1
From: Renton, WA
Here is a picture of the AP1 vs AP2 with stock factory gearing, with the HP converted. I have deleted the Torque to clean up the space a little bit.
All I took were the original dyno results for the HP and plugged them into the appropriate RPM range. so if 5000 rpm = 170 hp, that's what the hp figure is every time the graph crosses 5000 rpm. I believe this is what ZDan was talking about.
All I took were the original dyno results for the HP and plugged them into the appropriate RPM range. so if 5000 rpm = 170 hp, that's what the hp figure is every time the graph crosses 5000 rpm. I believe this is what ZDan was talking about.
Joined: Apr 2009
Posts: 2,521
Likes: 1
From: Renton, WA
psychoazn was kind enough to send me the excel data.
First, here is the "bare" dyno plots of the AP1 vs AP2.

I decided to go ahead and measure the area under the curves to determine how much powerband there really is. The AP2 has a higher power output, but the AP1 has a longer redline. Here it should be fairly obvious that the AP1 will have more powerband due to the increased redline.
And as it turns out, the AP1 has 16% more area than the AP2 from 3000 RPM to redline. If you consider powerband to be just VTAK, the AP1 walks away with 31% more area.
Now when we throw velocity plots into the mix, things get more interesting. I'm not 100% I actually uncovered anything, so this is subject to change. I could be calculating the wrong variables.
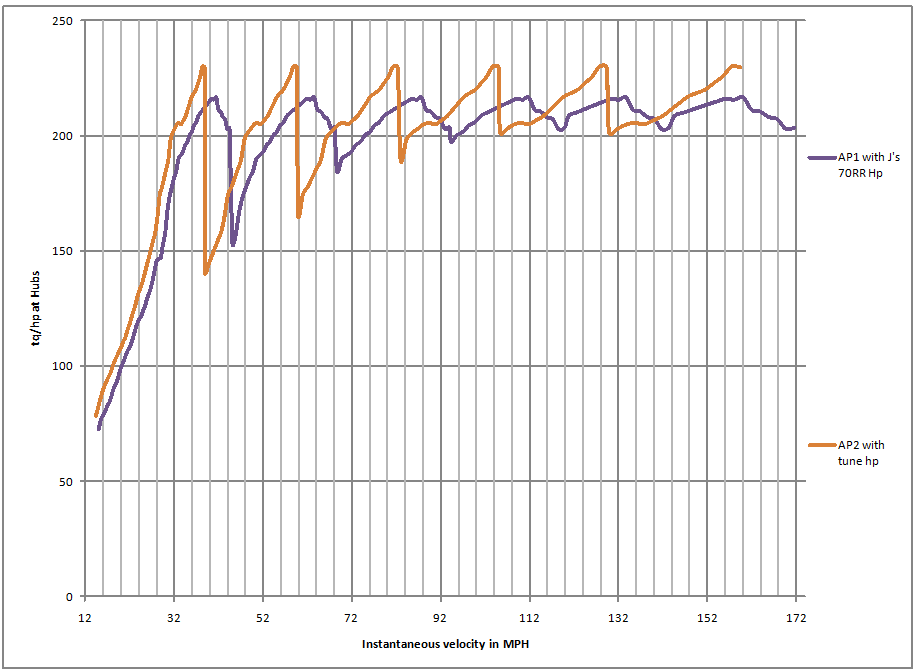
Here is the comparison chart of stock AP1 gearing versus stock AP2 gearing, with the same engines as in the dyno plot above.

But charts can be deceiving. I did three separate area under the curve calculations:
-Case 1: 6,000 RPM in 1st gear to 150 mph in 6th gear.
-Case 2: 3,000 RPM in 1st gear to 150 mph in 6th gear.
-Case 3: 30 mph in 1st gear to 150 mph in 6th gear
-Case 4: 6,000 RPM in 1st gear to Redline in 6th gear.
I chose 150 mph as the limit because frankly, you're not going to go much faster than this due to air resistance.
Case 1: AP2 has 0.83% advantage in area.
Case 2: AP2 has 0.93% advantage in area.
Case 3: AP2 has 0.18% advantage in area.
Case 4: AP1 has 7.32% advantage in area.
So with Factory gearing, the AP2 is actually SLIGHTLY better than the AP1 given the dyno data that we have, even though the AP1 walks away on the engine dyno in terms of powerband area. And really these percentages are well within margin of error, so you could call them a wash.
I also calculated psychoazn's AP1 with 4.57FD:
Compared to the AP2:
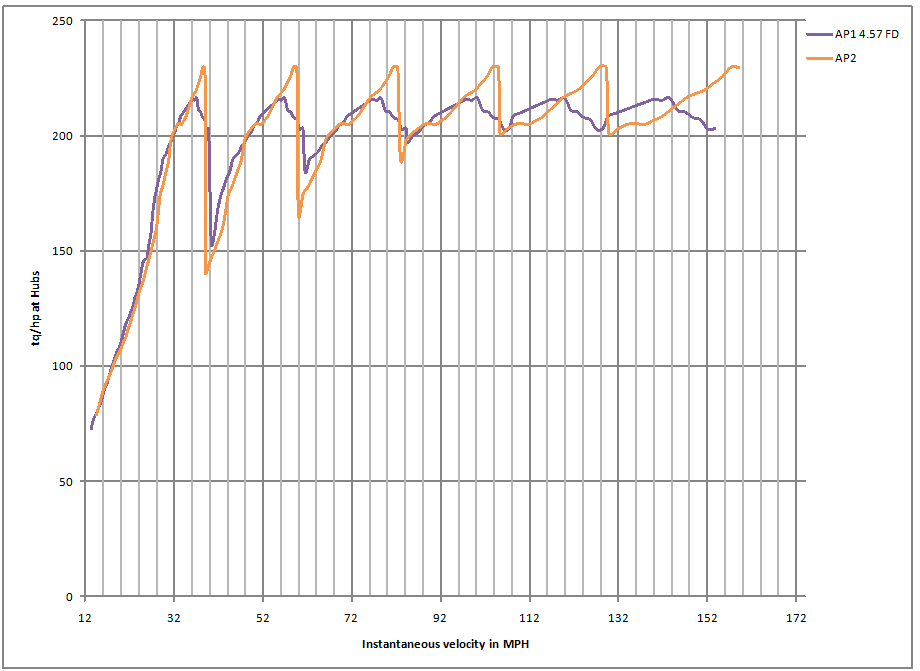
Case 1: 4.57FD AP1 has 2.23% advantage in area.
Case 2: 4.57FD AP1 has 1.31% advantage in area.
Case 3: 4.57FD has 0.69% advantage in area.
Case 4: AP2 has 3.52% advantage in area.
Compared to the stock AP1:

Case 1: 4.57FD AP1 has 3.06 advantage in area.
Case 2: 4.57FD AP1 has 2.23% advantage in area.
Case 3: 4.57FD AP1 has 0.88% advantage in area.
Case 4: Stock AP1 has 10.85% advantage in area.
The reason why in Case 2 the Stock AP1 has a greater advantage than in Case 1 is because I am choosing my areas based on RPM points, not on speed. The stock geared AP1 gains more speed per 100 rpm than a 4.57 FD AP1, even though the 4.57 FD AP1 would do so faster. This actually makes me wonder if area under the curve is a valid calculation, since a 4.57FD AP1 should be more like 10% faster, not the 0-3% that my numbers are giving me. Or perhaps I'm measuring the wrong variables?
Feel free to comment.. it's been a long day playing with spreadsheets and I'm starting to go insane, and I'm not sure if I've actually uncovered anything.
First, here is the "bare" dyno plots of the AP1 vs AP2.
I decided to go ahead and measure the area under the curves to determine how much powerband there really is. The AP2 has a higher power output, but the AP1 has a longer redline. Here it should be fairly obvious that the AP1 will have more powerband due to the increased redline.
And as it turns out, the AP1 has 16% more area than the AP2 from 3000 RPM to redline. If you consider powerband to be just VTAK, the AP1 walks away with 31% more area.
Now when we throw velocity plots into the mix, things get more interesting. I'm not 100% I actually uncovered anything, so this is subject to change. I could be calculating the wrong variables.
Here is the comparison chart of stock AP1 gearing versus stock AP2 gearing, with the same engines as in the dyno plot above.
But charts can be deceiving. I did three separate area under the curve calculations:
-Case 1: 6,000 RPM in 1st gear to 150 mph in 6th gear.
-Case 2: 3,000 RPM in 1st gear to 150 mph in 6th gear.
-Case 3: 30 mph in 1st gear to 150 mph in 6th gear
-Case 4: 6,000 RPM in 1st gear to Redline in 6th gear.
I chose 150 mph as the limit because frankly, you're not going to go much faster than this due to air resistance.
Case 1: AP2 has 0.83% advantage in area.
Case 2: AP2 has 0.93% advantage in area.
Case 3: AP2 has 0.18% advantage in area.
Case 4: AP1 has 7.32% advantage in area.
So with Factory gearing, the AP2 is actually SLIGHTLY better than the AP1 given the dyno data that we have, even though the AP1 walks away on the engine dyno in terms of powerband area. And really these percentages are well within margin of error, so you could call them a wash.
I also calculated psychoazn's AP1 with 4.57FD:
Compared to the AP2:
Case 1: 4.57FD AP1 has 2.23% advantage in area.
Case 2: 4.57FD AP1 has 1.31% advantage in area.
Case 3: 4.57FD has 0.69% advantage in area.
Case 4: AP2 has 3.52% advantage in area.
Compared to the stock AP1:
Case 1: 4.57FD AP1 has 3.06 advantage in area.
Case 2: 4.57FD AP1 has 2.23% advantage in area.
Case 3: 4.57FD AP1 has 0.88% advantage in area.
Case 4: Stock AP1 has 10.85% advantage in area.
The reason why in Case 2 the Stock AP1 has a greater advantage than in Case 1 is because I am choosing my areas based on RPM points, not on speed. The stock geared AP1 gains more speed per 100 rpm than a 4.57 FD AP1, even though the 4.57 FD AP1 would do so faster. This actually makes me wonder if area under the curve is a valid calculation, since a 4.57FD AP1 should be more like 10% faster, not the 0-3% that my numbers are giving me. Or perhaps I'm measuring the wrong variables?
Feel free to comment.. it's been a long day playing with spreadsheets and I'm starting to go insane, and I'm not sure if I've actually uncovered anything.

Joined: Apr 2008
Posts: 1,840
Likes: 21
From: Salt Lake City, UT
Thank you very much for your calculation. That is exactly how I would have gone about doing the comparisons, with the AUC calculations. Could you do one more calculation for us? Most tracks have a pretty narrow range of MPH, and we rarely see 1st gear or 150 mph. Could you do one more comparison, where minimum speed is 35 mph and maximum speed is 110 mph? Thank you!
Joined: Apr 2009
Posts: 2,521
Likes: 1
From: Renton, WA
Sure.
35 MPH to 110 MPH:
AP1: 7,000 RPM in 1st gear to 8,200 RPM in 4th gear.
AP2: 7,300 RPM in 1st gear to 6,900 RPM in 5th gear.
AP1 4.57 FD: 7,800 RPM in 1st gear to 7,600 RPM in 5th gear
AP1 vs AP2:
In this case, AP1 has a 0.46% percent difference advantage in area under the curve.
AP1 vs AP1 4.57FD:
In this case, AP1 has a 0.54% percent difference advantage in area under the curve.
AP2 vs AP1 4.57FD:
In this case, AP2 has a 0.08% percent difference advantage in area under the curve.

Joined: Apr 2009
Posts: 2,521
Likes: 1
From: Renton, WA
I'll just do AP1 vs AP2 unless someone wants to see the 4.57FD as well...
25 MPH to 60 MPH:
AP1: 5,000 RPM in 1st gear to 7,800 RPM in 2th gear.
AP2: 5,200 RPM in 1st gear to 5,900 RPM in 3th gear.
AP2 has a 2.37% percent difference advantage in area under the curve.
25 MPH to 65 MPH:
AP1: 5,000 RPM in 1st gear to 8,500 RPM in 2th gear.
AP2: 5,200 RPM in 1st gear to 6,400 RPM in 3th gear.
AP2 has a 0.05% percent difference advantage in area under the curve.
30 MPH to 60 MPH:
AP1: 6,000 RPM in 1st gear to 7,800 RPM in 2th gear.
AP2: 6,300 RPM in 1st gear to 5,900 RPM in 3th gear.
AP2 has a 1.01% percent difference advantage in area under the curve.
30 MPH to 65 MPH:
AP1: 6,000 RPM in 1st gear to 8,500 RPM in 2th gear.
AP2: 6,300 RPM in 1st gear to 6,400 RPM in 3th gear.
AP1 has a 1.35% percent difference advantage in area under the curve.
Now keep in mind this is not an exact science.. Even a 100 rpm difference in my selection box will throw the figures off by 1%.
Also for the 60mph cases, note that the AP2 is actually shifting into 3rd gear to hit 60 mph. These charts don't account for the competitive advantage of not having to shift. In reality you'd be better off redlining 2nd gear in the AP2.

Registered User
Joined: Jul 2007
Posts: 1,569
Likes: 0
From: El Monte
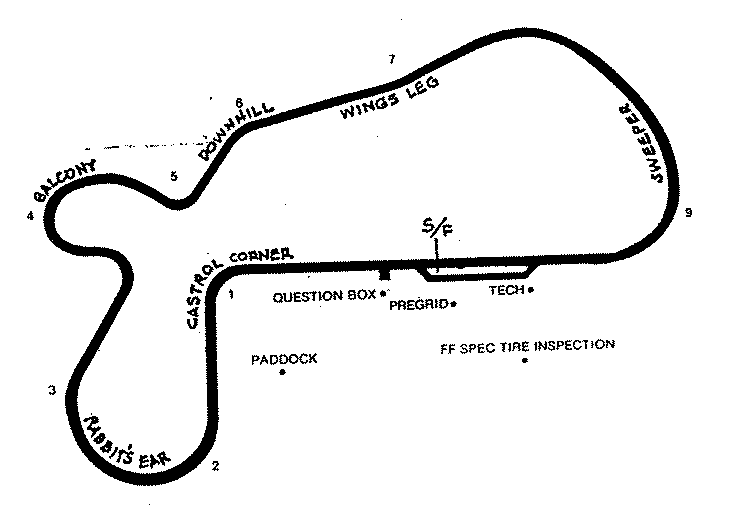
I did a similar analysis with a favorite socal track, big willow. I looked at my min/max speeds for four main straights and did a similar area under the curve summation. The four straights and my speeds (mph) are:
85 < Front straight <117
74 < turn 1 to 2 < 93
86 < turn 2 to 3 < 96
60 < Turn 5 to 8 < 115
Using spet's spreadsheet, I hypothesized that a stock ap2 has a 0.9% advantage over a stock ap1
Thread Starter
Joined: Sep 2004
Posts: 6,223
Likes: 4
From: Orange County, CA
Travis, what are your min and max speeds between each braking point and what time are you running on the lap you used for data?
I'm thinking of making a spreadsheet with higher resolution (higher sampling rate) and charts for all the socal tracks
I'm thinking of making a spreadsheet with higher resolution (higher sampling rate) and charts for all the socal tracks
Registered User
Joined: Jul 2007
Posts: 1,569
Likes: 0
From: El Monte
I looked at three laps that are in the 1:40 range and averaged the speeds to obtain what I posted above. I'm not what you mean by "between braking points;" max speed is right at a braking point usually, I think.