
Shifting


Registered User
Joined: Feb 2004
Posts: 154
Likes: 0
From: KC
Thanks johninator,
I have been looking for the gearing/speed comparison between MY03 and MY04 for a couple of weeks.
Where did that S2000 info. come from?
Gringo.
I have been looking for the gearing/speed comparison between MY03 and MY04 for a couple of weeks.
Where did that S2000 info. come from?
Gringo.
Originally posted by johninator
Hear is something you can use handily:
S2000 Gearing and Speed Calculations
Hear is something you can use handily:
S2000 Gearing and Speed Calculations

Registered User
Joined: Jul 2003
Posts: 497
Likes: 0
From: Fullerton
Originally posted by Gringo
Thanks johninator,
I have been looking for the gearing/speed comparison between MY03 and MY04 for a couple of weeks.
Where did that S2000 info. come from?
Gringo.
Thanks johninator,
I have been looking for the gearing/speed comparison between MY03 and MY04 for a couple of weeks.
Where did that S2000 info. come from?
Gringo.
Its actually a snapshot from a spreadsheet where you can manipulate shift points, gearing, power so you can see the changes right away.
There is an active website that does the gearing and speed calcs using asp or java script but I can't recall the url right now but it does not include the power and efficiency calcs on the last two columns.


Joined: Oct 2000
Posts: 9,210
Likes: 7
From: WA
We have been through this many times.. you must consider the mechanical advantage of the gearing as well as engine output. It turns out the shifting at the redline will result in the maximum force and acceleration as shown on this Honda chart.
http://www.honda.co.jp/factbook/auto/s2000...ge3/011_002.jpg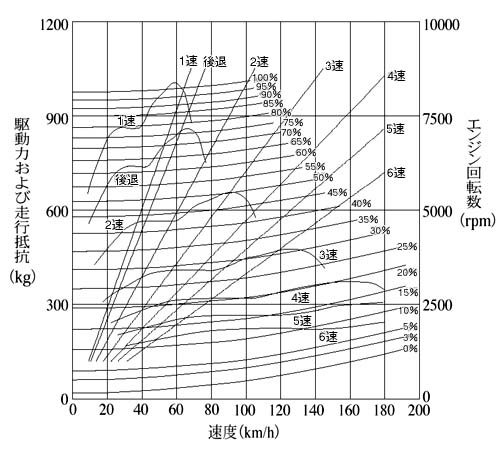
http://www.honda.co.jp/factbook/auto/s2000...ge3/011_002.jpg

Registered User
Joined: Jul 2003
Posts: 497
Likes: 0
From: Fullerton
Originally posted by cdelena
We have been through this many times.. you must consider the mechanical advantage of the gearing as well as engine output. It turns out the shifting at the redline will result in the maximum force and acceleration as shown on this Honda chart.
http://www.honda.co.jp/factbook/auto/s2000...ge3/011_002.jpghttp://www.honda.co.jp/factbook/auto/s2000...ge3/011_002.jpg
Nice chart. Is there an english version of the fact sheets for our car? I like reading through the technical details about our car except I can't understand it.
Im not clear with a couple of things though. What is the slightly rising horizontal lines from 0% to 100%. And what are those numbers representing the left vertical axis? Thanks.
John

Registered User
Joined: Jul 2003
Posts: 497
Likes: 0
From: Fullerton
Youre right about the torque on the left side. But the right side is the engine RPMs. How bout the curves that has 0% to 100% on them?
So far here is what I got:
The 6 or 7 torque curves are the torque curves in each gear as a function of Speed
The 6 or 7 straight lines are the calculated speed for each gear going through each RPM sweep.
The percentage curves from the bottom to the top is still unknown to me. What is it for and how is it used? Efficiency plot for engine output and speed?
The torque curve and gearing plot for an unlabeled gear is also unknown to me. Does that involve the primary gear reduction? I have a guess that that unlabled gear plot and torque curve is connected to the percentage plots.

